
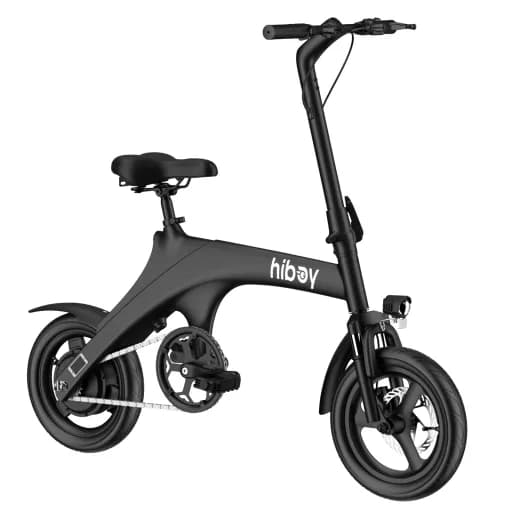
D3 Pro
Fiido
Payback in
6mo
374 Wh~36 mi tested39 lb
$399
View bike →
A car costs more per kilometre than the dashboard fuel number - depreciation, parking, maintenance and insurance add up. We do the full math against what an e-bike actually costs to run.
We compute what you currently spend per replaceable km, subtract the e-bike's running cost per km, and project the gap over time.
Car cost per mi = fuel (L/100km ÷ 100 × $/L) + maintenance $0.10 + depreciation $0.21 + parking $0.03
E-bike running cost per mi = electricity (15 Wh/km × $/kWh ÷ 1000) + maintenance $0.07, plus $108/yr service
CO₂ avoided = replaceable km/yr × 165 g/km (car ~170, e-bike ~5)
| Item | Value | Annual |
|---|---|---|
| Replaced {u}/yr | 1,809 | - |
| Current cost / mi | $0.55 | $1,003 |
| E-bike cost / mi | $0.08 | $248 |
| Net saving | - | $755 |
Constants are EU averages. Local figures vary - adjust your inputs for accuracy.

Some links are affiliate links - we may earn a commission at no cost to you. Sponsored picks are clearly labelled.
We'll send your personal report - annual savings, payback timeline, CO₂ avoided and 3 bikes that fit your numbers. Use it to convince your accountant, your partner, or just yourself.
How we work out what you save by swapping car or transit trips for an e-bike, including running costs, payback period and CO2 avoided.
It is a free tool that estimates how much money you save per year by replacing car, transit or rideshare trips with an electric bike. It compares the full cost of your current transport against an e-bike's running cost, then shows your annual saving, payback period, five-year position and the CO2 you avoid.
We work out your cost per kilometre by car, multiply it by the kilometres you can realistically replace each year, and subtract the e-bike's running cost over the same distance. The difference is your annual saving. Payback period is then your bike's purchase price divided by that annual saving.
We include more than just fuel. Car cost per kilometre combines fuel (your consumption times the fuel price), plus EU-average maintenance of about 0.06 euros, depreciation of about 0.12 euros and parking of about 0.02 euros per kilometre. These hidden costs are why a car is far more expensive per kilometre than the pump price suggests.
Very little. An e-bike uses roughly 15 watt-hours per kilometre, so at a typical electricity price of 0.30 euros per kilowatt-hour, charging costs under half a cent per kilometre. Even with maintenance and an annual service included, an e-bike's running cost is a small fraction of a car's.
The payback period is how long it takes for your savings to cover the price of the bike. It is calculated as the e-bike's purchase price divided by your annual saving, expressed in months or years. A short commute that replaces expensive car trips can pay back a bike in well under a year.
For the trips it can replace, almost always. Cars carry high fixed and per-kilometre costs through fuel, depreciation, insurance, maintenance and parking, while an e-bike costs a few cents per kilometre to run. The more car trips you replace, the larger the saving, which is why the percentage of replaceable trips matters so much.
We multiply the kilometres you replace by the difference in emissions between a car (about 170 grams of CO2 per kilometre) and an e-bike (about 5 grams per kilometre). The result is shown in kilograms of CO2 avoided per year, plus an equivalent in trees, so the environmental benefit is easy to picture.
Not every journey suits an e-bike, so this slider lets you be honest about how many of your current trips you would actually switch. Short, predictable trips replace easily, while long motorway runs do not. Setting a realistic percentage keeps the savings estimate grounded rather than assuming you abandon the car entirely.
Yes. You can switch the current mode to car, transit or rideshare. For transit we use your monthly pass cost pro-rated by replaceable trips, and for rideshare we use your cost per kilometre. The e-bike comparison stays the same, so you can see savings against whichever mode you use today.
The constants are EU averages, so the figures are calibrated estimates for guidance rather than a precise quote. Local fuel, electricity and tax conditions vary, so for the most accurate result you should override the defaults with your own numbers. Every figure is transparent and shown in the methodology, so you can see exactly how it is built.
 Savings
Wondering if an e-bike is worth the investment? We break down the costs and savings so you can see how much money you could keep in your pocket.
 Savings
Discover the real payback time for an e-bike. Learn how savings from replacing car trips, maintenance, and parking add up to make your e-bike free.
 Commuting
Wondering if an e-bike makes sense for a 10-mile commute? We break down cost, time, and savings to help you decide.