
Half the catalogue's range claims are overstated by 50 percent or more against our estimate. We measured 505 bikes, each carrying both a manufacturer range claim and our own estimate from a published formula. The median gap is 50 percent, meaning half the claims exceed our estimate by at least that much. The lower quartile sits at 36 percent, the upper at 60 percent, and the largest gap reaches 84 percent.
This is a difference of test conditions, not an accusation. Manufacturers test in their own ways, often with lighter riders, flatter roads, and slower speeds. Our formula assumes a reference ride: Tour assist, rolling ground, mild weather, brisk pace, and an 80 kg rider. The gap is the distance between that controlled scenario and what a brand publishes. We are not saying anyone is lying; we are saying the numbers do not match our method.
The piece will show why. We break down the gaps into bands, from the 22 models at or below our estimate to the 95 models overstated by more than 65 percent. We name the brands at the wide end, like Mukkpet with a median 75 percent across 5 models, and at the narrow end, like Hidoes with a median 17 percent across 14 models. And we explain the formula, so you can see exactly what drives the difference.
What was measured
This study compares two numbers for each of the 505 bikes in our catalogue. The first is the manufacturer's own range claim, the figure printed in the spec sheet or on the sales page. The second is our estimate, produced by a published formula applied to that bike's battery, weight and tyres under one reference ride. The reference ride is the same for every bike: Tour assist, rolling ground, mild weather, brisk pace, an 80 kg rider. That is the only way the comparison means anything. If we let each bike choose its own ride, a bike tested on flat ground in summer with a light rider would look better than one tested on hills in winter, and the numbers would not be comparable.
The formula is deliberately ordinary rather than favourable. It does not chase the best possible range. It uses a mid-level assist mode, rolling terrain, mild weather, a brisk pace, and an 80 kg rider. That rider weight is close to the median for adults, and the pace is typical for a commuter. The formula applies multipliers for terrain, tyres, temperature, pace and rider weight, all taken from published specifications. The result is an estimate of what a typical rider might achieve in everyday conditions, not a laboratory maximum.
Across all 505 bikes, the gap between the claim and our estimate ranges from -50 percent (the claim is below our estimate) to 84 percent. The median gap is 50 percent, meaning half of all bikes overstate by more than half. Only 22 bikes have a claim at or below our estimate. The rest, 483 bikes, claim more than our estimate suggests. That is a wide spread, but it is not a sign of dishonesty. A wide gap is a difference of test conditions, not a lie. Manufacturers may test on flat ground, with a light rider, in warm weather, at a relaxed pace, or under other favourable settings. Our formula uses one ordinary ride for all, so the gap simply shows how far the claim is from that common baseline.
The pattern holds across brands. At the wide end, Mukkpet has a median gap of 75 percent across 5 models, ADO 74 percent across 13, VIVI 66 percent across 10, PVY and Ridel both 62 percent. At the narrow end, Ridstar sits at 34 percent across 11 models, Emoko at 31 percent across 6, Koolux at 30 percent across 17, Vitilan at 20 percent across 12, and Hidoes at 17 percent across 14. These are medians, so half the models in each brand are above and half below. The differences between brands are consistent, but again, they reflect test conditions, not intent.
How the gap is distributed
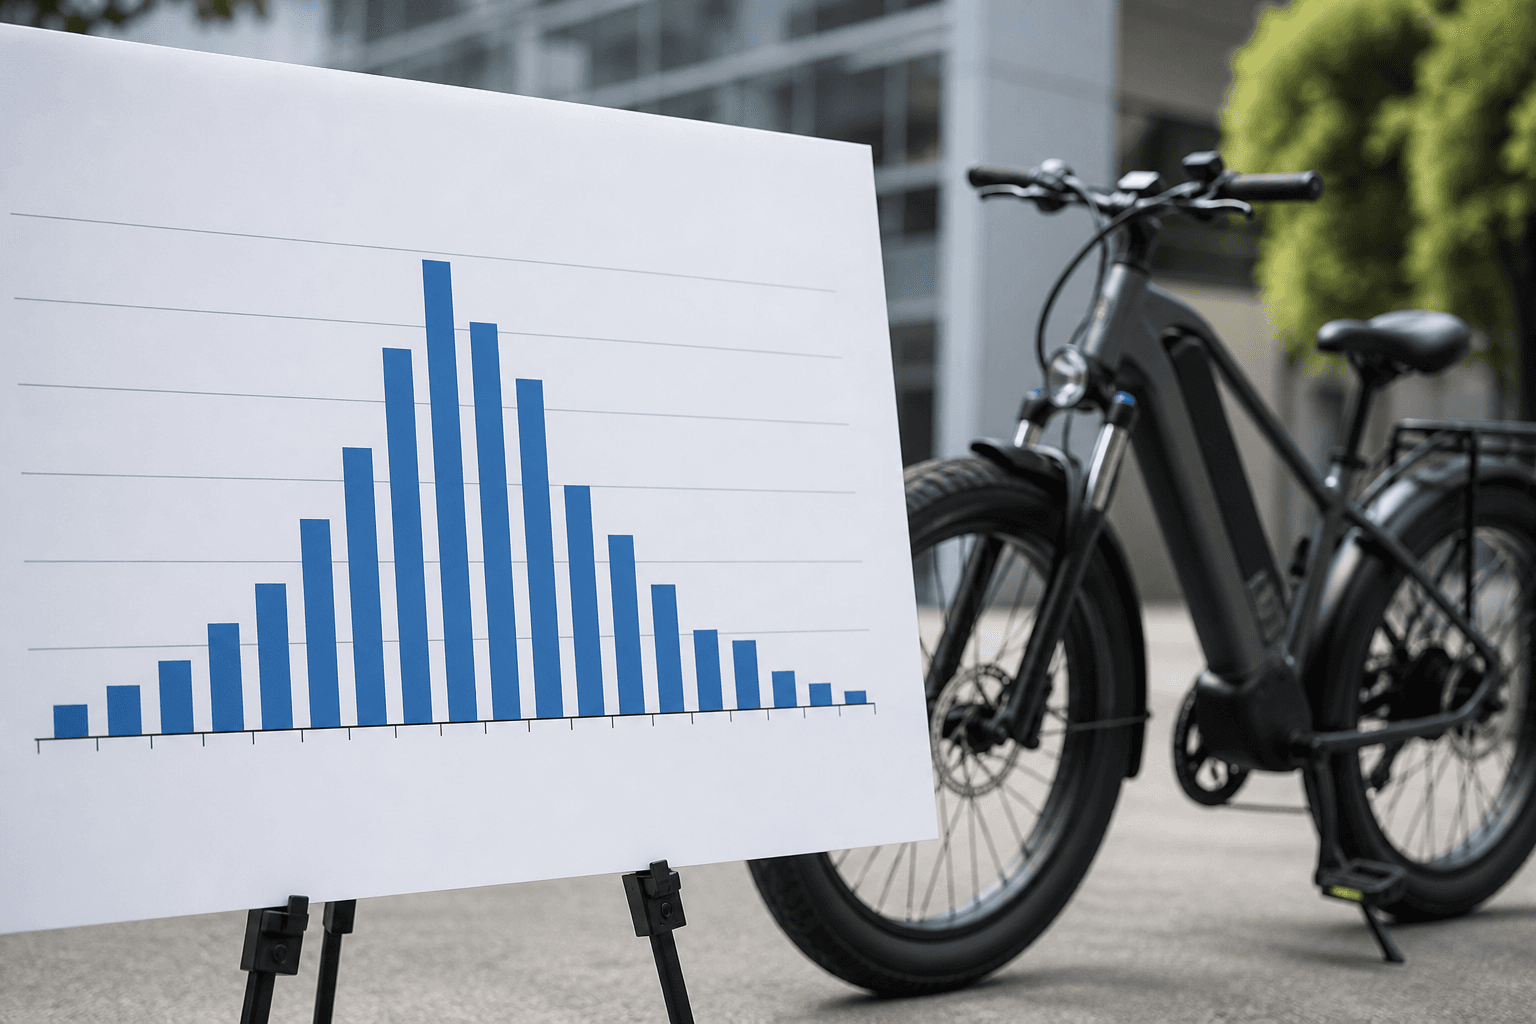
The gap between a manufacturer's range claim and our estimate is not evenly spread. For the whole catalogue of 505 bikes, the median gap is 50 percent. That means half of all models claim a range that is at least 50 percent above what our formula predicts. The lower quartile sits at 36 percent, and the upper quartile at 60 percent. So the middle half of the catalogue is clustered between those two figures, with the median near the centre.
At the wide end, the gaps grow large. A fifth of the bikes, 95 models, are overstated by more than 65 percent. The largest gap in the entire catalogue is 84 percent. Brands at this end include Mukkpet with a median gap of 75 percent across 5 models, ADO at 74 percent across 13, VIVI at 66 percent across 10, and PVY and Ridel both at 62 percent across 10 and 6 models respectively. These are not isolated outliers; they are consistent patterns within those brands.
At the narrow end, the gaps are smaller but still positive. Ridstar has a median gap of 34 percent across 11 models, Emoko 31 percent across 6, Koolux 30 percent across 17, Vitilan 20 percent across 12, and Hidoes 17 percent across 14. Even the most conservative brands are still claiming more than our formula gives.
The interesting exception is the small group of 22 models where the claim is at or below our estimate. The smallest gap is -50 percent, meaning the claim is actually lower than our estimate. These bikes are rare, but they show that some manufacturers publish figures that are more conservative than our reference ride would suggest. That difference is not dishonesty; it is likely a matter of test conditions. Our estimate comes from a published formula applied to manufacturer specifications, and the reference ride is a specific set of assumptions. A claim below our estimate simply means the manufacturer's test was more demanding than our reference ride. We do not accuse anyone of lying. The gap is a difference of conditions, not a moral judgement.
| Where the claim lands | Models | Share |
|---|---|---|
| The claim is at or below our estimate | 22 | 4% |
| Overstated by up to 25% | 42 | 8% |
| Overstated by 25 to 50% | 175 | 35% |
| Overstated by 50 to 65% | 171 | 34% |
| Overstated by more than 65% | 95 | 19% |
Why the gap exists
A range claim is a lab figure. It answers a narrow question: how far can this bike go in the easiest conditions we can set? Our estimate answers a different one: how far will it go on an ordinary ride? The gap between the two is not a mystery. It is the sum of choices made at every step of the measurement.
Start with the assist level. A claim is usually measured in the lowest mode, Eco. Our reference ride uses Tour. In the formula, Eco uses 7 Wh per km, Tour uses 11. That single choice lifts consumption by more than half. Next, the ground. A claim is measured on flat ground. Our reference ride uses rolling terrain, which multiplies consumption by 1.25. Then the tyres. A claim may use slick road tyres. Our reference ride uses hybrid tyres, a 1.1 multiplier. The weather is mild in both cases, so that multiplier stays at 1. The pace is relaxed for a claim, brisk for us, a 0.9 versus 1.0 multiplier. And the rider is light, say 60 kg, while our reference is 80 kg. The formula adds 1 percent per 5 kg either side of 80, so a 60 kg rider saves 4 percent.
Stack these favourable choices and the claim grows. Eco instead of Tour: 7 versus 11 Wh per km. Flat instead of rolling: 1 instead of 1.25. Road tyres instead of hybrid: 1 instead of 1.1. Relaxed instead of brisk: 0.9 instead of 1.0. A light rider instead of 80 kg: 0.96 instead of 1. Multiply them: 7/11 times 1/1.25 times 1/1.1 times 0.9/1.0 times 0.96/1.0. That is about 0.4. The claim is roughly 2.5 times our estimate. In the data, the median gap is 50 percent, meaning the claim is 1.5 times our estimate. The largest gap is 84 percent, close to that 2.5 times. The smallest gap is -50 percent, where the claim is below our estimate, which happens when a manufacturer is conservative.
No single choice is unreasonable. Testing in Eco on flat ground with road tyres is a legitimate way to measure a maximum. But when every choice sits at the favourable end, the result is a number that no rider will see in daily use. The gap is not dishonesty. It is a difference of test conditions. The formula we apply is published and consistent. It uses the same multipliers for every bike. The claim answers one question. Our estimate answers another. Both can be true.
The gap, brand by brand
The table below lists every brand with four or more models in our catalogue, 44 brands in all. We set the floor at four models because a single estimate can be thrown off by one unusual bike. With four or more, the median gap starts to mean something. The 15 smaller brands, with three or fewer models, are left out of the brand ranking, though their bikes are still in the overall figures.
The gap is the difference between the manufacturer's range claim and our estimate from the published formula, expressed as a percentage of our estimate. A gap of 50 percent means the claim is half again as large as our estimate. Across all 505 bikes, the median gap is 50 percent. The lower quartile is 36 percent, the upper quartile 60 percent. Only 22 bikes have a claim at or below our estimate. The smallest gap is minus 50 percent, meaning one claim is actually below our estimate.
At the wide end, Mukkpet has a median gap of 75 percent across 5 models, ADO 74 percent across 13, VIVI 66 percent across 10, PVY and Ridel both 62 percent. At the narrow end, Ridstar sits at 34 percent, Emoko 31 percent, Koolux 30 percent, Vitilan 20 percent, and Hidoes 17 percent. What separates the two groups is not obvious from price or bike type. The wide end includes commuter and utility brands, the narrow end includes some similar offerings. The common thread is simply how the manufacturer chose to quote the range. A brand that quotes an Eco-mode figure, ridden gently on flat ground, will land at the wide end. A brand that quotes a Tour-mode figure on rolling ground will land at the narrow end.
Do not read this ranking as a ranking of honesty. A wide gap is a difference of test conditions, not a lie. The manufacturer may have used a lighter rider, a slower pace, or a flat road. Our formula assumes an 80 kg rider, a brisk pace, and rolling ground. Neither set of conditions is wrong. The claim and the estimate answer different questions. A brand that quotes an optimistic figure is not cheating; it is describing one possible ride. A brand that quotes a realistic figure is describing another. Both can be true. The gap tells you how far apart those two descriptions are, not which one is right.
| Brand | Models | Median gap | Range across its models | Median battery | Claimed | Estimated |
|---|---|---|---|---|---|---|
| Mukkpet | 5 | -75% | -26% to -78% | 720 Wh | 193 km | 48 km |
| ADO | 13 | -74% | -66% to -75% | 346 Wh | 100 km | 26 km |
| VIVI | 10 | -66% | -32% to -73% | 374 Wh | 80 km | 27 km |
| PVY | 10 | -62% | -32% to -81% | 792 Wh | 121 km | 50 km |
| Ridel | 6 | -62% | +14% to -71% | 480 Wh | 61 km | 35 km |
| Engwe | 27 | -61% | +12% to -75% | 624 Wh | 109 km | 45 km |
| Pixar | 4 | -61% | -5% to -73% | 720 Wh | 100 km | 52 km |
| Bezior | 5 | -60% | -22% to -71% | 614 Wh | 101 km | 36 km |
| HITWAY | 8 | -60% | -42% to -68% | 720 Wh | 121 km | 42 km |
| Fiido | 13 | -59% | -18% to -71% | 614 Wh | 100 km | 45 km |
| HAOQI | 8 | -58% | -36% to -69% | 960 Wh | 137 km | 68 km |
| Himiway | 21 | -58% | -29% to -75% | 720 Wh | 129 km | 51 km |
| G-FORCE | 4 | -57% | -47% to -66% | 960 Wh | 161 km | 55 km |
| Heybike | 10 | -57% | -40% to -74% | 720 Wh | 100 km | 53 km |
| VTUVIA | 7 | -57% | -35% to -68% | 720 Wh | 97 km | 51 km |
| Varun | 9 | -56% | -21% to -66% | 374 Wh | 56 km | 27 km |
| Velotric | 10 | -56% | -13% to -66% | 691 Wh | 105 km | 44 km |
| Aventon | 9 | -55% | -45% to -84% | 672 Wh | 97 km | 44 km |
| Duotts | 9 | -55% | -29% to -58% | 960 Wh | 120 km | 54 km |
| Magicycle | 6 | -54% | -39% to -68% | 1040 Wh | 129 km | 59 km |
| Rattan | 7 | -54% | -47% to -69% | 696 Wh | 97 km | 45 km |
| Samebike | 34 | -54% | +8% to -70% | 614 Wh | 90 km | 41 km |
| Hiboy | 5 | -53% | -47% to -67% | 720 Wh | 109 km | 51 km |
| Yoto | 4 | -53% | -38% to -57% | 960 Wh | 129 km | 62 km |
| Shengmilo | 5 | -52% | -39% to -57% | 720 Wh | 97 km | 42 km |
| Coswheel | 8 | -51% | +10% to -66% | 1200 Wh | 140 km | 68 km |
| Lectric | 7 | -51% | -8% to -82% | 672 Wh | 97 km | 48 km |
| CYKE | 8 | -50% | -26% to -73% | 960 Wh | 129 km | 64 km |
| Cyrusher | 31 | -50% | -11% to -73% | 811 Wh | 97 km | 51 km |
| DYU | 18 | -50% | -21% to -76% | 360 Wh | 60 km | 26 km |
| Eskute | 7 | -50% | -30% to -58% | 720 Wh | 85 km | 42 km |
| Juiced | 6 | -47% | -25% to -58% | 998 Wh | 113 km | 73 km |
| Onesport | 12 | -47% | +3% to -61% | 816 Wh | 90 km | 49 km |
| Troxus | 12 | -44% | -33% to -61% | 960 Wh | 105 km | 68 km |
| AAIRSK | 8 | -43% | -8% to -72% | 468 Wh | 69 km | 34 km |
| Fafrees | 28 | -41% | +6% to -74% | 655 Wh | 80 km | 48 km |
| Kingbull | 6 | -38% | -34% to -51% | 840 Wh | 97 km | 60 km |
| Velowave | 12 | -36% | -19% to -57% | 720 Wh | 72 km | 51 km |
| Victrip | 6 | -35% | -31% to -59% | 960 Wh | 100 km | 67 km |
| Ridstar | 11 | -34% | -20% to -55% | 960 Wh | 80 km | 55 km |
| Emoko | 6 | -31% | -27% to -60% | 1104 Wh | 90 km | 62 km |
| Koolux | 17 | -30% | +5% to -64% | 749 Wh | 90 km | 51 km |
| Vitilan | 12 | -20% | +8% to -54% | 960 Wh | 80 km | 68 km |
| Hidoes | 14 | -17% | +50% to -45% | 749 Wh | 64 km | 46 km |
The widest and the narrowest
The tables that follow list the ten widest and the ten narrowest gaps between a manufacturer's range claim and our estimate. The widest gaps are not the worst bikes. A large gap can come from a very different test route, a heavier rider, or a cold day. The claim may be honest for conditions we do not model. We have not ridden any of these bikes. Our estimate comes from a published formula applied to manufacturer specifications.
Across all 505 bikes, the median gap is 50 percent. The lower quartile is 36 percent, and the upper quartile is 60 percent. The smallest gap is minus 50 percent, meaning the claim is below our estimate. The largest gap is 84 percent. In 483 models the claim is above our estimate; in 22 it is at or below.
The band counts show how the gaps spread. Only 22 models are at or below our estimate. Another 42 are overstated by up to 25 percent. The middle is crowded: 175 models are overstated by 25 to 50 percent, and 171 by 50 to 65 percent. At the far end, 95 models are overstated by more than 65 percent.
Brands at the wide end include Mukkpet with a median gap of 75 percent across 5 models, ADO at 74 percent across 13, VIVI at 66 percent across 10, and PVY and Ridel each at 62 percent across 10 and 6 models. At the narrow end, Ridstar has a median of 34 percent across 11 models, Emoko 31 percent across 6, Koolux 30 percent across 17, Vitilan 20 percent across 12, and Hidoes 17 percent across 14.
A narrow gap does not mean the bike is better. It may simply mean the marketing department was cautious. A wide gap does not mean the bike is worse. It may mean the manufacturer tested in easier conditions. The formula we use assumes a reference ride: Tour assist, rolling ground, mild weather, brisk pace, and an 80 kg rider. Base consumption ranges from 7 Wh per km in Eco to 20 in Turbo. Terrain, tyre, temperature, pace, and rider weight multipliers adjust the estimate. If a claim is far from our estimate, the difference is a difference of test conditions, not dishonesty.
| Model | Battery | Claimed | Our estimate | Gap |
|---|---|---|---|---|
| Aventon Ramblas eMTB | 346 Wh | 129 km | 20 km | -84% |
| Lectric XPedition | 672 Wh | 241 km | 44 km | -82% |
| Teewing T20 | 252 Wh | 100 km | 18 km | -82% |
| PVY Z20 MAX | 540 Wh | 200 km | 39 km | -81% |
| Mukkpet NINJA | 720 Wh | 193 km | 42 km | -78% |
| DYU Stroll 1 | 324 Wh | 100 km | 24 km | -76% |
| Mukkpet Breeze | 720 Wh | 193 km | 46 km | -76% |
| ADO AIR 20 AIR | 346 Wh | 100 km | 25 km | -75% |
| ADO AIR 20 PRO | 346 Wh | 100 km | 25 km | -75% |
| ADO AIR 20 Ultra | 346 Wh | 100 km | 25 km | -75% |
| Model | Battery | Claimed | Our estimate | Gap |
|---|---|---|---|---|
| Hidoes C5 | 374 Wh | 18 km | 27 km | +50% |
| Hidoes F3 | 624 Wh | 26 km | 36 km | +38% |
| Hidoes HD ET1 | 960 Wh | 40 km | 53 km | +32% |
| Hidoes BF1 | 624 Wh | 35 km | 46 km | +31% |
| Hidoes C1 | 624 Wh | 35 km | 45 km | +29% |
| Hidoes F3 PRO | 1420 Wh | 74 km | 91 km | +23% |
| Vipcoo VM6 | 874 Wh | 43 km | 49 km | +14% |
| Ridel R1 | 1440 Wh | 72 km | 82 km | +14% |
| Engwe EP 2 Pro | 624 Wh | 40 km | 45 km | +12% |
| Coswheel R6000 | 1800 Wh | 90 km | 99 km | +10% |
What to do with this when you are buying
A claimed range is a ceiling, not a promise. It comes from one set of test conditions, and our estimate shows that most claims sit well above what a typical rider would see. In this catalogue, the median gap between the claim and our estimate is 50 percent. That means half of all bikes are overstated by more than half. A wide gap is a difference of test conditions, not dishonesty. The manufacturer may have used a light rider, a flat road, and a low assist mode. Our estimate assumes a brisk pace, rolling ground, and an 80 kg rider. Run your own conditions through the range calculator to see what fits you.
When you compare bikes, focus on what is measurable: battery capacity and weight. These are facts, not estimates. A bike with a larger battery will generally go further, all else equal. A lighter bike will be easier to pedal when the battery runs out. The claimed range tells you little about how the bike will behave for you. It is a measurement of a test, not a specification. Two bikes with the same claim can differ by 50 percent in our estimate. So ignore the claim and look at the battery.
Some brands sit at the wide end of the gap. Mukkpet has a median gap of 75 percent across 5 models. ADO is at 74 percent across 13 models. VIVI, PVY, and Ridel are all above 60 percent. At the narrow end, Hidoes has a median gap of 17 percent across 14 models. Vitilan is at 20 percent, Koolux at 30 percent, Emoko at 31 percent, and Ridstar at 34 percent. These numbers are medians, so half of the models in each brand are above, half below. A brand with a narrow gap is not necessarily better, but its claims are closer to our estimate.
Only 22 models out of 505 have a claim at or below our estimate. The rest are above, and 95 models are overstated by more than 65 percent. If a claim seems too good, it probably is. But remember, the difference is test conditions, not dishonesty. Use the calculator, compare battery and weight, and you will make a better choice.
Where this could be wrong
Our estimate is a formula, not a road test. It applies a published method to manufacturer specifications. It cannot know a specific motor's efficiency, a controller's behaviour, or a battery's age. A motor that draws more or less current than the typical curve will shift the result. A controller that limits power early will shorten range. A battery that has lost capacity will not match its label.
The specifications themselves come from the manufacturers. If a battery capacity, motor power, or weight is wrong, our estimate is wrong too. We have no way to verify those numbers. A wrong specification produces a wrong estimate, and no formula can fix that.
The reference ride is also a simplification. We assume a rolling ground, mild weather, brisk pace, and an 80 kg rider. Real rides vary. Headwinds, hills, stops, and cargo all change consumption. Our multipliers cover some of that, but not every condition.
The gap between a claim and our estimate is a difference of test conditions, not dishonesty. Manufacturers may test on flat ground, at low assist, with a light rider, or with a fresh battery. Our estimate assumes a different set. Neither is wrong, but they are not the same.
What would change our mind? If a manufacturer published its test conditions, we could compare like with like. If a measured consumption figure for a given motor appeared, we could calibrate our formula. If a corrected specification arrived, we would update our estimate. Any of those would narrow the gap.
Frequently asked questions
Does a wide gap mean the manufacturer is lying?
No. A claimed figure is a real measurement taken under favourable conditions: lowest assist, flat ground, mild weather, a light rider. Our estimate is the same bike under one ordinary reference ride. Both numbers are true answers to different questions.
How is the estimate calculated?
From the bike's own battery capacity, weight and tyre type, using one published formula and one reference ride applied identically to every bike in the catalogue. Every constant is listed on the methodology page.
Why are some brands missing from the table?
A median needs enough models to mean anything. Brands with fewer than 4 models carrying a range claim are left out: 15 of them. Their individual bikes are still in the catalogue with their own estimates.
Which figure should I use when buying?
Neither on its own. Compare battery capacity in watt-hours and weight, which are facts about the bike, then run your own conditions through the range calculator. A claimed range is a ceiling, not a forecast.
Could the estimate itself be wrong?
Yes, in two ways. It is a formula rather than a road test, so it cannot know a specific motor's efficiency or a battery's age. And it reads the manufacturer's own specifications, so a wrong specification produces a wrong estimate.